- Home Page
- Somerset Profile
- Electoral Division Profiles
- Local Community Networks
- Joint Strategic Needs Assessment
- Census 2021
- Census 2011
- People & Neighbourhoods
- Health and Wellbeing
- Crime & Community Safety
- Economy & Jobs
- Education, Skills and Learning
- Environment
- Housing
- Travel and Access
- SINePost
- Children & Young People
- Older People
- Somerset Maps
- Somerset Geographies
- County Council Election Results
- Contact us
SINePost newsletter - August 2013
 In this issue ...
- Somerset Economic Assessment 2013
- Somerset’s Food and Drink Sector: A Profile
- Road Traffic Volumes
- Life Expectancy
- Disability-Free Life Expectancy (DFLE)
- Drug Misuse: Crime Survey for England and Wales
- Update to Local Health tool
- Carbon Dioxide Emissions
- Census 2011: Home Ownership and Renting
- Timescale for release of Travel-to-Work flow data
- Pupils with Special Educational Needs
- Perils of Perception: The divide between public views and evidence
- Forthcoming Statistical Releases
 1. Somerset Economic Assessment 2013
Somerset County Council’s Economy Group has published its latest Somerset Economic Assessment (SEA). The report, State of the Somerset Economy 2013, provides a profile of the local economy and forms a common evidence base for policy and strategy. It can be downloaded from the Somerset Intelligence website at the following link: www.somersetintelligence.org.uk/somerset-economic-assessment/
Key headlines from the Somerset Economic Assessment 2013 include:
- Unemployment rates in Somerset are lower than the national average, with ILO unemployment at 4%, whilst the claimant count also remains low at 2.3%.
- Between 2009 and 2011, Somerset’s GVA grew more quickly than nationally, increasing by 5.8% compared to 3.2% for the UK as a whole. The Somerset economy is therefore marginally (0.4%) larger than in 2007 and the UK economy is 1.8% smaller.
- The County’s business population has contracted over the last three years with the stock of enterprises in 2011 4% lower than the 2008 peak.
- Business confidence is down on last year. Businesses have identified a number of barriers to business growth: lack of consumer demand (36%); difficulties in accessing finance (26%); external restrictions (planning, licensing, regulations) (16%); lack of suitable staff (15%); lack of investment (14%).
2. Somerset’s Food and Drink Sector: A Profile
Meanwhile, the Senior Economist at Somerset County Council has compiled a report on the size and role of the food and drink sector in the county. The sector is significant in employment terms, providing at least 19,000 jobs.
The report presents a range of data on food and drink businesses, employment and productivity (GVA), considering the current profile of the sector and how it is projected to change and develop in the future. See: www.somersetintelligence.org.uk/economic-research/
 3. Road Traffic Volumes
The Department for Transport (DfT) has released annual traffic volumes for 2012 by local authority. Data for Somerset indicates 16 million fewer vehicle miles in 2012 than in 2011, the fourth successive year-on-year decrease and mirroring the national trend. However, the Somerset total of 3,838 million vehicle miles is 14% higher than the figure in 2000.
On major roads, light good vehicles (vans) are the only category of vehicle with consistently increasing total flows in the county. The busiest stretch of road remains the M5 between Junctions 24 and 25. The Somerset Intelligence briefing paper on transport statistics, including data on buses and railway stations, will be updated shortly. For details of all road traffic statistics, see: www.gov.uk/government/organisations/department-for-transport/series/road-traffic-statistics
4. Life Expectancy
Latest figures (for 2009-11) from the Office for National Statistics (ONS) put life expectancy at birth at 80.0 years for males and 83.8 years for females in Somerset. Nationally, male life expectancy at birth varies from 83.0 years (in East Dorset) down to 73.8 (Blackpool). Female life expectancy at birth ranges from 86.4 years (East Dorset) to 79.3 years (Manchester): www.ons.gov.uk/ons/publications/re-reference-tables.html?edition=tcm%3A77-314574
Between 2000-02 and 2009-11 there was an improvement in life expectancy of 2.6 years for males in Somerset and 1.9 years for females. The discrepancy between male and female life expectancies continues to steadily narrow, reducing from 4.5 years in 2000-02 to 3.8 years in 2009-11. Some analysts predict that by 2030, male and female life expectancies will be broadly equal.
5. Disability-Free Life Expectancy (DFLE)
The ONS has released some data and analysis highlighting the differences between life expectancy and disability-free life expectancy (DFLE) in different deprivation groups. Disability-free life expectancy estimates lifetime free from a limiting persistent illness or disability.
Around 20,000 Somerset residents live in areas amongst the 20% most deprived in the country. In these areas men can expect 15 fewer years and women 13.5 fewer years disability free living than men and women in the least deprived areas. These differences mean that neither men nor women in these areas can expect to get to normal retirement age without some form of limiting persistent illness or disability.
The full report and associated data is available at: www.ons.gov.uk/ons/rel/disability-and-health-measurement/sub-national-health-expectancies/inequality-in-disability-free-life-expectancy-by-area-deprivation--england--2003-06-and-2007-10/index.html
 6. Drug Misuse: Crime Survey for England and Wales
The Home Office has released its annual analysis of drugs misuse, which looks at the extent and trends in illicit drug use among a sample of 16 to 59 year olds in England and Wales: www.gov.uk/government/publications/drug-misuse-findings-from-the-2012-to-2013-csew
The report finds that overall levels of drug use continue to decline. Key facts from the 2012/13 report include:
- Around 1 in 12 (8.2%) adults took an illicit drug (excluding mephedrone) in the last year, a fall compared with 2011/12 (8.9%).
- Young adults (those aged 16 to 24) were more likely to have used drugs in the last year than older adults. However, the proportion of 16-24s taking any drug in the last year was 16.3%, down from 19.3% in 2011/12.
- Just under one-third (32%) of adults aged 16 to 59 thought that it was acceptable for people of their own age to take cannabis occasionally, while 7% thought it was acceptable to take cocaine occasionally.
 7. Update to Local Health tool
Local Health, the online data tool maintained by Public Health England, has been updated with new indicators and an improved interface. The new indicators are derived from the 2011 Census, while updated indicators include those relating to child obesity, child development and low birth weight.
The tool enables users to see how health outcomes and factors affecting health vary across England, at local authority (district) and ward level. The tool offers maps, summary charts and more detailed reports to show how local results compare with the national average for each indicator. See: www.localhealth.org.uk
8. Carbon Dioxide Emissions
The Department for Energy and Climate Change (DECC) has published estimates of carbon dioxide (CO2) emissions for 2011, and revised estimates for the years 2005-2010, for all UK local authorities: www.gov.uk/government/publications/local-authority-emissions-estimates
Overall carbon dioxide emissions in Somerset have steadily declined from 9.7 tonnes per person in 2005, to 7.8 tonnes per person in 2011, mirroring a national downward trend. In Somerset, around 35% of emissions relate to road transport, 32% to industry/commerce and 28% to domestic use.
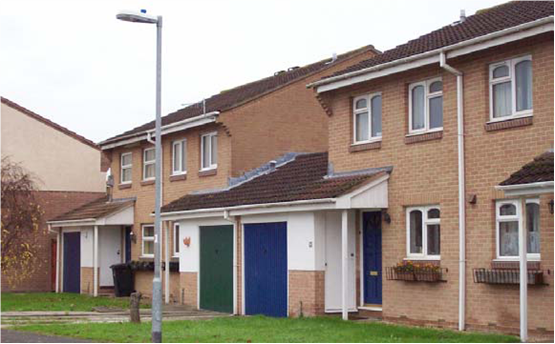 9. Census 2011: Home Ownership and Renting
The ONS recently published detailed data from the 2011 Census on home ownership, including information about household size, number of bedrooms and characteristics of the household reference person (HRP - in most households this is the oldest full-time worker). Findings for Somerset include:
- Two person households are the most common household size, however, looking at rented accommodation only; one-person households are the most common.
- Among owner occupied households containing one person, 92% live in homes with two or more bedrooms. In rented homes containing one person, 52% have two or more bedrooms.
- Focusing on the household reference person, 79% of those aged 65 or over own their own home. The proportion of owner occupiers among those aged 16-34 has declined from 57% in 2001 to just 37% in 2011.
Further details are available at: www.somersetintelligence.org.uk/housing-tenure.html
10. Timescale for release of Travel-to-Work flow data
In response to a Census User Group query about the release of travel-to-work flow data (indicating travel patterns of workers from their place or residence to place of work), the ONS has now indicated that the data will be available ‘by February 2014’.
 11. Pupils with Special Educational Needs
The Department for Education (DfE) has published national tables on numbers of school pupils with statements of special educational needs (SEN), at local authority level: www.gov.uk/government/publications/special-educational-needs-in-england-january-2013
As at January 2013 there were 1,164 pupils in Somerset with statements of special educational need, representing 1.5% of all pupils, and a decline of around 100 pupils on the previous year. Somerset continues to have one of the lowest proportions of pupils with statements; only four local authorities in England have a lower rate.
12. Perils of Perception: The divide between public views and evidence
A recent survey commissioned by the Royal Statistical Society (RSS) has highlighted how public perception can be at odds with official statistics on a range of key social issues. Examples highlighted include:
- Crime: 58% do not believe that crime is falling, when the Crime Survey for England and Wales suggests that incidents of crime were 19% lower in 2012 than in 2006-7 and 53% lower than in 1995.
- Benefit fraud: people estimate that 34 times more benefit money is claimed fraudulently than official estimates (of £0.70 per £100).
- Teenage pregnancy: on average, the public thinks teenage pregnancy is 25 times higher than official estimates (of around 0.6% of girls aged under 16).
Further details of the survey available on the RSS website: www.rssenews.org.uk/2013/07/rss-commission-new-research-into-public-perceptions-of-statistics
13. Forthcoming Statistical Releases
The following datasets are due for release at sub-regional geographies during August:
- Population by Country of Birth and Nationality – 2012 (ONS)
- Parents' country of birth, England and Wales – 2012 (ONS)
- Local Area Migration Indicators Suite – Interactive Tool (ONS)
- Homelessness Prevention and Relief - 2012/13 (DCLG)
- Public Health Outcomes Framework - August 2013 data update (PHE)
And finally ...
- If you have any news or articles you’d like to share
- If any of the links in this newsletter don’t work
- If you would like to unsubscribe
Please email TXAtkins@somerset.gov.uk
 Read our SINePost monthly newsletter
Did you know?
You can see Care Quality Commission ratings for all places in Somerset where they regulate care on our CQC ratings dashboard.