- Home Page
- Somerset Profile
- Local Community Network Profiles
- Electoral Division Profiles
- Joint Strategic Needs Assessment
- Census 2021
- Census 2011
- People & Neighbourhoods
- Health and Wellbeing
- Crime & Community Safety
- Economy & Jobs
- Education, Skills and Learning
- Environment
- Housing
- Travel and Access
- SINePost
- Somerset Maps
- Somerset Geographies
- External Data Sources
- Election Results
- Contact us
Alcohol Harm Index methodology
Background
Directors of Public Health are designated as one of the Responsible Authorities (RA) for all alcohol licensing decisions in England. Since there is currently no explicit licensing objective around health, any representations need to be based on the Licensing Act 2003[1]. The four objectives are oriented around public safety, prevention of nuisance, child protection and crime prevention.
As a RA, Public Health teams[2]:
- Submit a representation in response to an application for a new or existing premises
- Negotiate conditions with an applicant
- Support reviews of premises licences or club premises certificates where there are problems with one or more of the Licensing Objectives
- Help develop and review Cumulative Impact Assessments (CIA)
In 2016, Public Health England developed and piloted an Analytical Software Package (ASP) to help public health teams in their role as a responsible authority, with support of the Home Office and the Department of Health.
Subsequently, versions are used by local authorities in Cornwall, Wigan and Leeds. Somerset County Council Public Health have developed a version of the ASP to inform the licensing process. Like other’s versions, it is designed as a straightforward one-stop resource with links to various data sources to provide supportive evidence linked to alcohol related harm. The results from the tool will be used as part of representations to licensing applications.
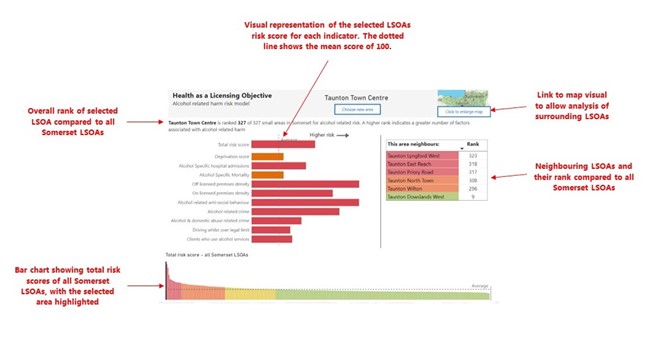
A postcode can be inputted into the tool, which then provides an overall comparative county wide “harm ranking” at a Lower-layer Super Output Area level (LSOA)[3] in which the postcode sits. An overall risk score is calculated for each area, along with risk scores for each data indicator. The tool calculates relative risk within Somerset and is not intended for comparisons outside of the local context.
Data
Data sets have been chosen due to their relevance to alcohol related harm or the Licensing Objectives. To enable comparison, we have used the statistical method, Z-scoring. This provides a standardised scale for all indicators. For each indicator the data points have been given a Z-score, which represents how far each LSOA score is away from the mean for that indicator. A Z-score tells you how many standard deviations away each data point is from the mean.
Put more simply, the Z-score illustrates how an LSOA compares to the average for Somerset for that indicator. A positive Z-score represents an LSOA which scores above the average, and a negative Z-score represents an LSOA which scores below the average. A score of 0 represents the Somerset average. We have concluded that all data sets are not equally relevant in respect of the four Licensing Objectives, therefore the data is weighted based on their relevance. This is achieved by allocating each data indicator a weighting score of 1-3; the higher the score the more this data contributes to the overall “harm ranking”. The Z-scores have then been multiplied by the weighting, providing a weighted Z-score.
To enable easy visual presentation by avoiding negative scores, a large constant - in this case 100 - has been added to each weighted Z-score. For this tool, therefore, a score of 100 represents the average for each indicator, whilst a score above 100 is above average and below 100 is below average. The further away from 100 an LSOA score is, in either direction, the more ‘extreme’ the data point for that indicator is.
To calculate an overall risk score for each LSOA, the mean of the weighted Z-scores has been calculated.
Score of 1
General data or alcohol-related health data is included to ‘set the scene’ of the wider alcohol-related harm in an area. Evidence demonstrates the data has a broad association with harm from alcohol but is not directly linked to the 4 licensing objectives. Including this data recognises the contextual factors that have an impact on alcohol consumption and alcohol related harm.
Score of 2
These indicators are directly associated with harm from alcohol and evidence demonstrates direct association with the four licensing objectives.
Score of 3
These indicators are considered to have the most significant link to harm from alcohol and the four licensing objectives.
Each data set will be routinely updated to keep the data relevant.
Publication
The tool is published to Somerset’s Public Health Intelligence website, www.somersetintelligence.org.uk/alcohol-harm-index
Much of the data which underpins the analysis is considered to be sensitive and cannot be published freely. For many indicators, the underlying data from which the risk scores are calculated can be viewed by hovering over the relevant indicator. For those where the underlying data cannot be shared freely, hovering over the indicator will show that the data is “supressed”.
GDPR
This project is using many data sets from various sources, due to using information about individuals for a purpose it is not currently used for we assessed it was necessary to complete a Data Protection Impact Assessment (DPIA).
We have received data that is specifically necessary for the project. When requesting data from colleagues or other organisations, we have discussed with them what we need and ensured the data received is only strictly relevant to the project and does not allow us to identify individuals or specific incidents. The Alcohol Harm Index tool does not require personal data. The output of the tool generates risk factors, based on the data indicators as described. The tool will not show any user numbers of individuals or incidents per LSOA, MSOA[4] or postcode. They will only see values calculated as a comparison to the average.
All data sets used to calculate averages are stored electronically in a restricted access folder.
Version 2
Version 2 of the tool was published on Tuesday 03rd January 2023.
Name change
It was decided to change the name of the tool to Alcohol Harm Index. This is firstly due to another database and a service in Somerset also being called Halo, leading to potential confusion. Secondly, feedback from colleagues who felt the name “Health as a Licensing Objective (HaLO)” was an unhelpful distraction from the purpose of the tool, which is to provide a summary of evidence of alcohol harm in localities.
Data sets used
From feedback, it was found some of the data sets associated with alcohol were less relevant and distracted from what the tool was designed to represent and its relevance to the licensing process. Several datasets have been removed and new data added. Further details are included in the following updated data schedule.
Neighbouring LSOAs
Version 2 also includes a function that identifies and includes surrounding LSOAs of an application location. This is to give a more comprehensive picture of alcohol harm in the area being assessed.
Example of Alcohol Harm Index report
Leeds City Council
Adam Taylor, Senior Information Analyst and Sue Duckworth, Principal Licensing Officer, Leeds City Council have been helpful, sharing their methodology and learning to support the development of our version.
Data schedule (updated December 2022)
|
Indicator |
Weight |
|
|
Deprivation score |
1 |
|
|
English Indices of Deprivation 2019. The English indices of deprivation measure relative deprivation in small areas (LSOAs) in England. For more information or to access the dataset, see www.gov.uk/government/statistics/english-indices-of-deprivation-2019. |
||
|
Last updated: January 2022 |
Data Review Date: January 2024 |
|
|
Alcohol Specific admission all ages - any hospital |
3 |
|
|
Admissions to hospital where the primary diagnosis or any of the secondary diagnoses are an alcohol-specific (wholly attributable) condition. Directly age standardised rate per 100,000 population (standardised to the European standard population). Data for period 2016/17 – 2020/21. |
||
|
Last updated: January 2022 |
Data Review Date: January 2023 |
|
|
Alcohol Related admission all ages - any hospital |
2 |
|
|
Admissions to hospital where the primary diagnosis or any of the secondary diagnoses are an alcohol-attributable code. Directly age standardised rate per 100,000 population (standardised to the European standard population). Data for period 2016/17 – 2020/21. |
||
|
Last updated: January 2022 |
Data Review Date: N/a |
|
|
Removed December 2022. Alcohol Specific admissions adequately demonstrates area of harm |
||
|
Alcohol Specific Mortality |
2 |
|
|
Deaths from alcohol-specific conditions, all ages, directly age-standardised rate per 100,000 population (standardised to the European standard population). Deaths which have been wholly caused by alcohol consumption. Data for period 2016/17 – 2020/21. |
||
|
Last updated: January 2022 |
Data Review Date: January 2023 |
|
|
Alcohol Related Mortality |
1 |
|
|
Deaths from alcohol-related conditions, all ages, directly age-standardised rate per 100,000 population (standardised to the European standard population). Each alcohol related death is assigned an alcohol attributable fraction based on underlying cause of death (and all cause of deaths fields for the conditions: ethanol poisoning, methanol poisoning, toxic effect of alcohol). Data for period 2016/17 – 2020/21. |
||
|
Last updated: January 2022 |
Data Review Date: N/a |
|
|
Removed December 2022. Alcohol Specific Mortality adequately demonstrates area of harm |
||
Population aged 16 and under |
1 |
|
|
All residents aged 16 or under according to the ONS 2020 mid-year population estimates. |
||
|
Last updated: January 2022 |
Data Review Date: N/a |
|
|
Removed December 2022. Association with alcohol harm too vague |
||
|
Looked After Children |
1 |
|
|
Number of children in the care of the local authority. Data provided by Somerset County Council. |
||
|
Last updated: July 2021 |
Data Review Date: N/a |
|
|
Removed December 2022. Association with alcohol harm too vague |
||
|
Youth offences |
1 |
|
|
Number of young people issued with a youth caution, youth conditional caution, or other youth justice intervention. Data from the local authority Youth Offending Team for the period 2016 - 2021. |
||
|
Last updated: January 2022 |
Data Review Date: N/a |
|
|
Removed December 2022. Association with alcohol harm too vague |
||
|
% did not achieve grade 4+ in English and Maths |
1 |
|
|
Percentage of key stage 4 level students in state funded education who did not achieve grade 4 or higher in both English and Maths. |
||
|
Last updated: January 2022 |
Data Review Date: N/a |
|
|
Removed December 2022. Association with alcohol harm too vague |
||
|
Alcohol Licensing - Off licensed premises density |
3 |
|
|
Number of premises with a license to sell alcohol for off-premises consumption, divided by the total extent standard area measurement. |
||
|
Last updated: July 2023 |
Data Review Date: January 2024 |
|
|
Alcohol Licensing - On licensed premises density |
2 |
|
|
On-licensed premises density – Number of premises with a license to sell alcohol for on-premises consumption, divided by the total extent standard area measurement. |
||
|
Last updated: July 2023 |
Data Review Date: January 2024 |
|
|
Alcohol related anti-social behaviour |
3 |
|
|
Alcohol related anti-social behaviour – Avon & Somerset Police data covering the period January 2018 to December 2022. Number of recorded anti-social behaviour incidents. |
||
|
Last updated: July 2023 |
Data Review Date: January 2024 |
|
|
Alcohol flagged total crime - Excluding violent crime |
3 |
|
|
Avon & Somerset Police data covering the period April 2015 to June 2021. Total number of crimes recorded and flagged as alcohol related, except for crimes of type ‘Violence against the person’. |
||
|
Last updated: August 2021 |
Data Review Date: N/a |
|
|
Removed December 2022. Alcohol flagged Total Crime - Excluding violent crime combined with Alcohol flagged Violent Crime |
||
|
Alcohol flagged violent crime |
3 |
|
|
Alcohol flagged Violent Crime – Avon & Somerset Police data covering the period April 2015 to June 2021. Number of crimes recorded as ‘Violence against the person’ and flagged as alcohol related. |
||
|
Last updated: August 2021 |
Data Review Date: N/a |
|
|
Removed December 2022. Alcohol flagged Total Crime - Excluding violent crime combined with Alcohol flagged Violent Crime |
||
|
Alcohol flagged crime |
3 |
|
|
Alcohol flagged crime – Avon & Somerset Police data. Number of crimes recorded with an alcohol marker on crime. Crime occurrences between January 2018 and December 2022. |
||
|
Last updated: July 2023 |
Data Review Date: January 2024 |
|
|
Domestic violence flagged crime |
3 |
|
|
Avon & Somerset Police data. Number of crimes recorded with both an alcohol marker and domestic violence marker. Crime occurrences between January 2018 and December 2022. |
||
|
Last updated: July 2023 |
Data Review Date: January 2024 |
|
|
Driving whilst over legal limit |
2 |
|
|
Avon & Somerset Police data covering the period from January 2018 to December 2022. Offences are counted against the offender’s home address, not the location where the offence was recorded. |
||
|
Last updated: July 2023 |
Data Review Date: January 2024 |
|
|
Clients who use SDAS services |
1 |
|
|
Number of individuals who have accessed structured treatment from Somerset Drug and Alcohol Service for either alcohol only or alcohol & non-opiate usage in the period 2020/21 – 2022/23. Individuals may be counted twice if they had separate treatment episodes whilst living at separate addresses. This includes individuals who started treatment prior to 2020/21 but were still in treatment during the specified period. |
||
|
Last updated: July 2023 |
Data Review Date: May 2024 |
|
[1] www.local.gov.uk/sites/default/files/documents/10%2036_Licensing_Act_2003_V04%203_1.pdf
[2] https://www.gov.uk/guidance/alcohol-licensing-a-guide-for-public-health-teams
[3] Lower-layer Super Output Areas (LSOAs) are small areas designed to be of a similar population size, with an average of approximately 1,500 residents or 650 households. There are 32,844 Lower-layer Super Output Areas (LSOAs) in England
[4] A Middle Layer Super Output Areas (MSOA) is a small geographic area with between 5,000 and 15,000 people living in it (the average is 7,200).
 Read our SINePost monthly newsletter
Did you know?
There are around 250,100 households in Somerset (Census 2021)