- Home Page
- Somerset Profile
- Local Community Network Profiles
- Electoral Division Profiles
- Joint Strategic Needs Assessment
- Census 2021
- Census 2011
- People & Neighbourhoods
- Health and Wellbeing
- Crime & Community Safety
- Economy & Jobs
- Education, Skills and Learning
- Environment
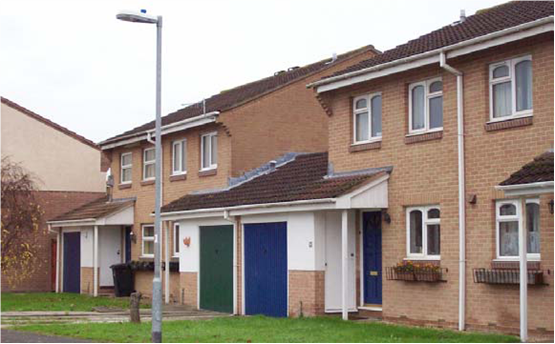
- Housing
- Travel and Access
- SINePost
- Somerset Maps
- Somerset Geographies
- External Data Sources
- Election Results
- Contact us
SINePost newsletter - June 2018
 In this issue ...
- Joint Strategic Needs Assessment (JSNA) 2018
- Population Projections
- Small Area Household Income Estimates
- Housing Affordability ratios
- Mortgage and Landlord Possession statistics
- Physical Activity in Adults estimates
- Small Area Child Obesity statistics
- Journey Times to Key Local Services
- Vehicle Statistics
- Internet User and Non-User estimates
- Educational Attainment by Age 19 statistics
- Forthcoming Statistical Releases
1. Joint Strategic Needs Assessment (JSNA) 2018
The latest annual JSNA Summary, providing an overview of the health, care and wellbeing needs of the population is now available on the Somerset Intelligence website:
www.somersetintelligence.org.uk/jsna/.
The summary report includes links to a much larger suite of underlying evidence for the JSNA which is maintained on the Somerset Intelligence website. The 28-page summary report supports the new draft ‘Improving Lives in Somerset’ Strategy (2019-2028) and is based around four priority areas that the Somerset Health and Wellbeing Board believe will make the biggest difference to improving the lives of the population.
A public consultation on the draft ‘Improving Lives’ strategy will be launching soon.
 2. Population Projections
From its current estimate of 551,400, Somerset’s population is projected to pass 575,000 by 2023 and to exceed 600,000 by the year 2031, in new projections released by the Office for National Statistics. Figures are based on current fertility, mortality and migration trends, and are presented by single year from 2016 to 2041.
The major component of the increase is a projected rise in the number of older residents. By 2031 there are anticipated to be an additional 35,000 Somerset residents aged 75 or over. By comparison, the size of Somerset’s ‘working age’ population will be broadly unchanged. The number of children and young people (aged 0-19) is projected to increase by 5,000 over the same period.
At a district level, Sedgemoor is projected to have the biggest overall population increase by 2031 (up 13%), followed by Taunton Deane (up 11%), Mendip (9%), South Somerset (6%) and West Somerset (3%).
See: www.ons.gov.uk/peoplepopulationandcommunity/populationandmigration/populationprojections
 3. Small Area Household Income Estimates
Average gross household annual income in Somerset ranges from £27,800 in part of Bridgwater to £52,500 in part of nearby rural Sedgemoor, according to new model-based ‘small area’ estimates from the Office for National Statistics. The estimates are based on MSOAs (Middle-layer Super Output Areas, typically with populations of around 7,000 people) and relate to the financial year 2015/16.
The estimates demonstrate wide geographical variations in household income throughout the county. With the exception of West Somerset, all districts have at least one MSOA with average income in excess of £45,000, while all districts have at least one area with average household income below £32,000.
See: www.ons.gov.uk/peoplepopulationandcommunity/personalandhouseholdfinances/incomeandwealth
 4. Housing Affordability ratios
House prices in Somerset remain high relative to earnings, in latest affordability estimates from the Office for National Statistics. The ratio of median house price to median gross annual earnings provides a measure of how affordable it is to get onto the property ladder.
On average, full-time workers in Somerset in 2017 could expect to pay 8.6 times their annual workplace-based earnings on purchasing a home. By comparison, the national average ratio in 2017 was 7.8. The analysis uses earnings data based on ‘place of work’ rather than the ‘place of residence’ to indicate the extent to which employees can afford to live where they work.
At a district level, the affordability ratio in 2017 ranged from 8.1 in Taunton Deane to 10.2 in Mendip. No figure is available for West Somerset. It may be noted that these ratios can hide considerable variations within districts, and between urban and rural areas.
For the full dataset, see: www.ons.gov.uk/peoplepopulationandcommunity/housing/bulletins/housingaffordabilityinenglandandwales
 5. Mortgage and Landlord Possession statistics
Possession claims issued by landlords in Somerset increased by 23% in 2017/18, while possession claims issued by mortgage lenders rose by 13%, according to annual figures from the Ministry of Justice.
There were a total of 879 claims submitted by landlords to repossess a property, and 135 claims submitted by mortgage lenders. Taunton Deane and Sedgemoor saw the highest rates of possession claims made (per household).
Since the economic recession, possession claims issued by mortgage lenders in Somerset have fallen significantly, while claims by landlords have been on a general upward trend.
 6. Physical Activity in Adults estimates
Public Health England (PHE) has updated its Physical Activity Data Tool with latest estimates of physically activity and inactivity in adults (in 2016/17):
https://fingertips.phe.org.uk/profile/physical-activity
It is estimated that 68.3% of adults (aged 19 or over) in Somerset in 2016/17 were physically active (defined as meeting the Chief Medical Officer’s recommendation of at least 150 moderate intensity equivalent minutes per week).
Furthermore, an estimated 19.6% of Somerset adults were physically inactive (defined as fewer than 30 moderate intensity equivalent minutes per week).
Somerset performed better than the national average in respect of both indicators.
 7. Small Area Child Obesity statistics
Public Health England has published latest small area (electoral ward and MSOA) data on child excess weight and obesity, combining three years of data from the National Child Measurement Programme (2014/15 to 2016/17). Electoral ward figures are estimated and modelled on MSOA-level data:
www.gov.uk/government/statistics/child-obesity-and-excess-weight-small-area-level-data
For Reception children in Somerset, estimated obesity rates range from 3.8% in Chewton Mendip and Ston Easton ward (Mendip) and in Camelot and Ivelchester wards (South Somerset), to 14.1% in East and West Polden wards (Sedgemoor). Seven of the top ten highest rates are in respect of South Somerset wards, with five in Chard.
For children in Year 6, estimated obesity rates are highest in Yeovil Central and Bridgwater Fairfax wards (24.2% and 23.9% respectively), with wards in Chard, Bridgwater and Street also appearing in the top ten.
Overall, Somerset has a lower prevalence of obesity among Reception children than the England average (8.7% compared to 9.3%) and a lower prevalence among Year 6 children (16.2% compared to 19.6%), based on the latest three year period.
 8. Journey Times to Key Local Services
Average minimum journey times for Somerset residents to a range of key local services are 24 minutes by public transport/walking, 21 minutes by cycle and 12 minutes by car, according to updated ‘accessibility’ estimates from the Department for Transport. Nationally, averages journey times are 18, 15 and 11 minutes respectively.
Key services are identified as: employment centres, primary schools, secondary schools, FE colleges, GPs, hospitals, food stores and town centres.
Since comparable figures were first produced in 2014, average journey times to the eight key services have increased in respect of each mode of transport, both in Somerset and nationally.
Full data tables, at county, district and LSOA (Lower-layer Super Output Area) level are available at: www.gov.uk/government/statistics/journey-time-statistics-2016
 9. Vehicle Statistics
The number of licenced vehicles in Somerset continues to increase, with an additional 6,300 vehicles recorded in 2017 compared to 2016, in figures from the Department for Transport. The total number of vehicles in Somerset has now reached 400,000.
At the end of 2017 there were 313,800 licensed cars in Somerset (an increase of 4,400 on the previous year). Numbers of motorcycles increased by approximately 400 to 16,700 over the same period, while numbers of Light Goods Vehicles (LGVs) increased by 1,200 to 46,200.
At a district level, South Somerset and Mendip saw the biggest absolute increases in numbers of vehicles (increases of 2,000 and 1,400 respectively). Car ownership now ranges from 67 per 100 adult population in Taunton Deane and in West Somerset to 72 per 100 adult population in Mendip. Nationally there are 60 licenced cars per 100 population.
See: www.gov.uk/government/statistical-data-sets/all-vehicles-veh01
 10. Internet User and Non-User estimates
An estimated 88% of adults in Somerset have used the internet in the last three months according to latest annual figures from the Office for National Statistics, based on the period January to March 2018. This compares to 82% of adults five years previously.
An estimated 54,000 adults (aged 16 and over) in Somerset have never used the internet or have not used it in the last three months. This compared to an estimated 76,000 adults five years ago.
National analysis continues to identify key non-users as people aged 75 or over (of which 51% have never used the internet) and people with a disability (of which 20% have never used the internet).
See: www.ons.gov.uk/businessindustryandtrade/itandinternetindustry/datasets/internetusers
 11. Educational Attainment by Age 19 statistics
Overall educational attainment by age 19 has increased marginally in Somerset, in annual figures from the Department for Education. In 2017:
- 85.7% of 19 year-olds were qualified to at least Level 2 (5 GCSEs at A*-C or equivalent), above the England average of 83.6%.
- 57.4% of 19 year-olds were qualified to at least Level 3 (2 A-levels or equivalent), in line with the national average (57.5%).
In terms of disadvantaged pupils, the attainment gap in Somerset between those eligible for Free School Meals (FSM) and those not eligible for FSM was 20.5 percentage points at Level 2 and 31.8 percentage points at Level 3, with both gaps exceeding national averages.
See: www.gov.uk/government/statistics/level-2-and-3-attainment-by-young-people-aged-19-in-2017
12. Forthcoming Statistical Releases
The following are due for release at sub-regional geographies during June:
- Fuel Poverty statistics: 2016 (DBE&IS)
- 2018 Child Health Profiles: pdf reports annual update (PHE)
- Statutory homelessness and homelessness prevention and relief (MHCLG)
- House price statistics for small areas: year ending December 2017 (ONS)
- Traveller caravan count: January 2018 (MHCLG)
- Local authority carbon dioxide emissions: 2016 estimates (DBE&IS)
And finally ...
- If you have any news or articles you’d like to share
- If any of the links in this newsletter don’t work
- If you would like to unsubscribe from the SINePost email alert
Please email TXAtkins@somerset.gov.uk
 Read our SINePost monthly newsletter
Did you know?
Somerset covers 3,452 square kilometres (1,333 square miles)